Won't you be my Valentine?
Won't you be my Valentine?
Introduction
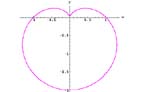
A simple plot in polar coordinates will produce a heart shaped function known as a cardioid.
Material
Mechanical version
Two disk shaped magnets
A piece of paper and a pencil.
Low-tech version
Polar plotting paper (Available in the book "Graph paper from your
copier")
A scientific calculator that can compute sine functions
High-tech version
A computer with access to the Web
Assembly
Mechanical version
Make a dot on one edge of one of the disk magnets, use ink or white-out, or nail polish.
Low-tech version, none.
High-tech version
Go to
http://mss.math.vanderbilt.edu/cgi-bin/MSSAgent/~pscrooke/MSS/plotpolar.def
or http://www.webmath.com/polar.html
To Do and Notice
Mechanical
Place one of the magnetic disks on a piece of white paper.
Place the second disk next to the first so that it is attracted.
Roll the second disk around the first one. Use the pencil to mark the
position of the dot on the second disk as it rolls completely around
the first disk once.
Connect the dots to create a cardioid.
Low-tech
Have students plot the function r = 1 - sin(T) where r is the radius and T is the angle in degrees with 0<T<360
High-tech
Enter the function 1-sin(t)
and the range tmin= 0, tmax=2*pi, notice that this angle is in radians.
press the plot button.
What's Going On?
The curve you produced is known as a cardioid. A cardioid can be defined as the trace of a point on a circle that rolls around a fixed circle of the same size without slipping.
The magnets are oriented so that they attract each other. The attraction produces enough friction that the magnet can roll without slipping easily.
So What?
The polar plot of the sensitivity of a cardioid microphone, or antenna, is a cardioid.
Etc.
Try variations on this function.
Predict what the graph will look like first.
r = 1 + sin(t)
r = 1 - 1.25 * sin(t)
r = 1
r = 1 + sin(t)
r = 1 + cos(t)
r = 1 - (sin(t))^3
r = 1 - (sin(t))^9
r = 1 - (sin(t))^99
Resources
Sources of information for Cardioids
http://www.best.com/~xah/SpecialPlaneCurves_dir/Cardioid_dir/cardioid.html
http://www-groups.dcs.st-andrews.ac.uk/%7Ehistory/Curves/Cardioid.html
A table of the Sine function is provided below.
Angle t, degrees sin(t)
|
0 |
0 |
|
20 |
0.34 |
|
40 |
0.64 |
|
60 |
0.87 |
|
80 |
0.98 |
|
100 |
0.98 |
|
120 |
0.87 |
|
140 |
0.64 |
|
160 |
0.34 |
|
180 |
0 |
|
200 |
-0.34 |
|
220 |
-0.64 |
|
240 |
-0.87 |
|
260 |
-0.98 |
|
280 |
-0.98 |
|
300 |
-0.87 |
|
320 |
-0.64 |
|
340 |
-0.34 |
|
360 |
0 |
|
Scientific Explorations with Paul Doherty |
|
21 Feb 99 |